Firms and markets I
Materials for class on Monday, February 25, 2019
Contents
Slides
Download the slides from today’s lecture.

XYZ Frames
Most profitable firms
| Firm | Frames produced | Total profit |
|---|---|---|
| Charlotte | 20 | $13.30 |
| Ryan | 19 | $12.15 |
| Rachel | 17 | $11.10 |
| Stan | 14 | $5.30 |
| Bruno | 16 | $4.70 |
| Melanie | 11 | $-0.35 |
Costs and revenues and profits
These are the totals across all six firms (3 per section).
| Round | Viable units produced | Sticks used | Corners used | People used | Cost of desk | Cost of scissors | Cost of sticks | Cost of corners | Cost of labor |
|---|---|---|---|---|---|---|---|---|---|
| 1 | 5 | 28 | 28 | 6 | 6 | 3 | 2.8 | 1.4 | 2.4 |
| 2 | 12 | 63 | 62 | 12 | 6 | 3 | 6.3 | 3.1 | 4.8 |
| 3 | 21 | 105 | 105 | 21 | 6 | 3 | 10.5 | 5.25 | 8.4 |
| 4 | 28 | 125 | 123 | 24 | 6 | 3 | 12.5 | 6.15 | 9.6 |
| 5 | 31 | 136 | 136 | 23 | 6 | 3 | 13.6 | 6.8 | 9.2 |
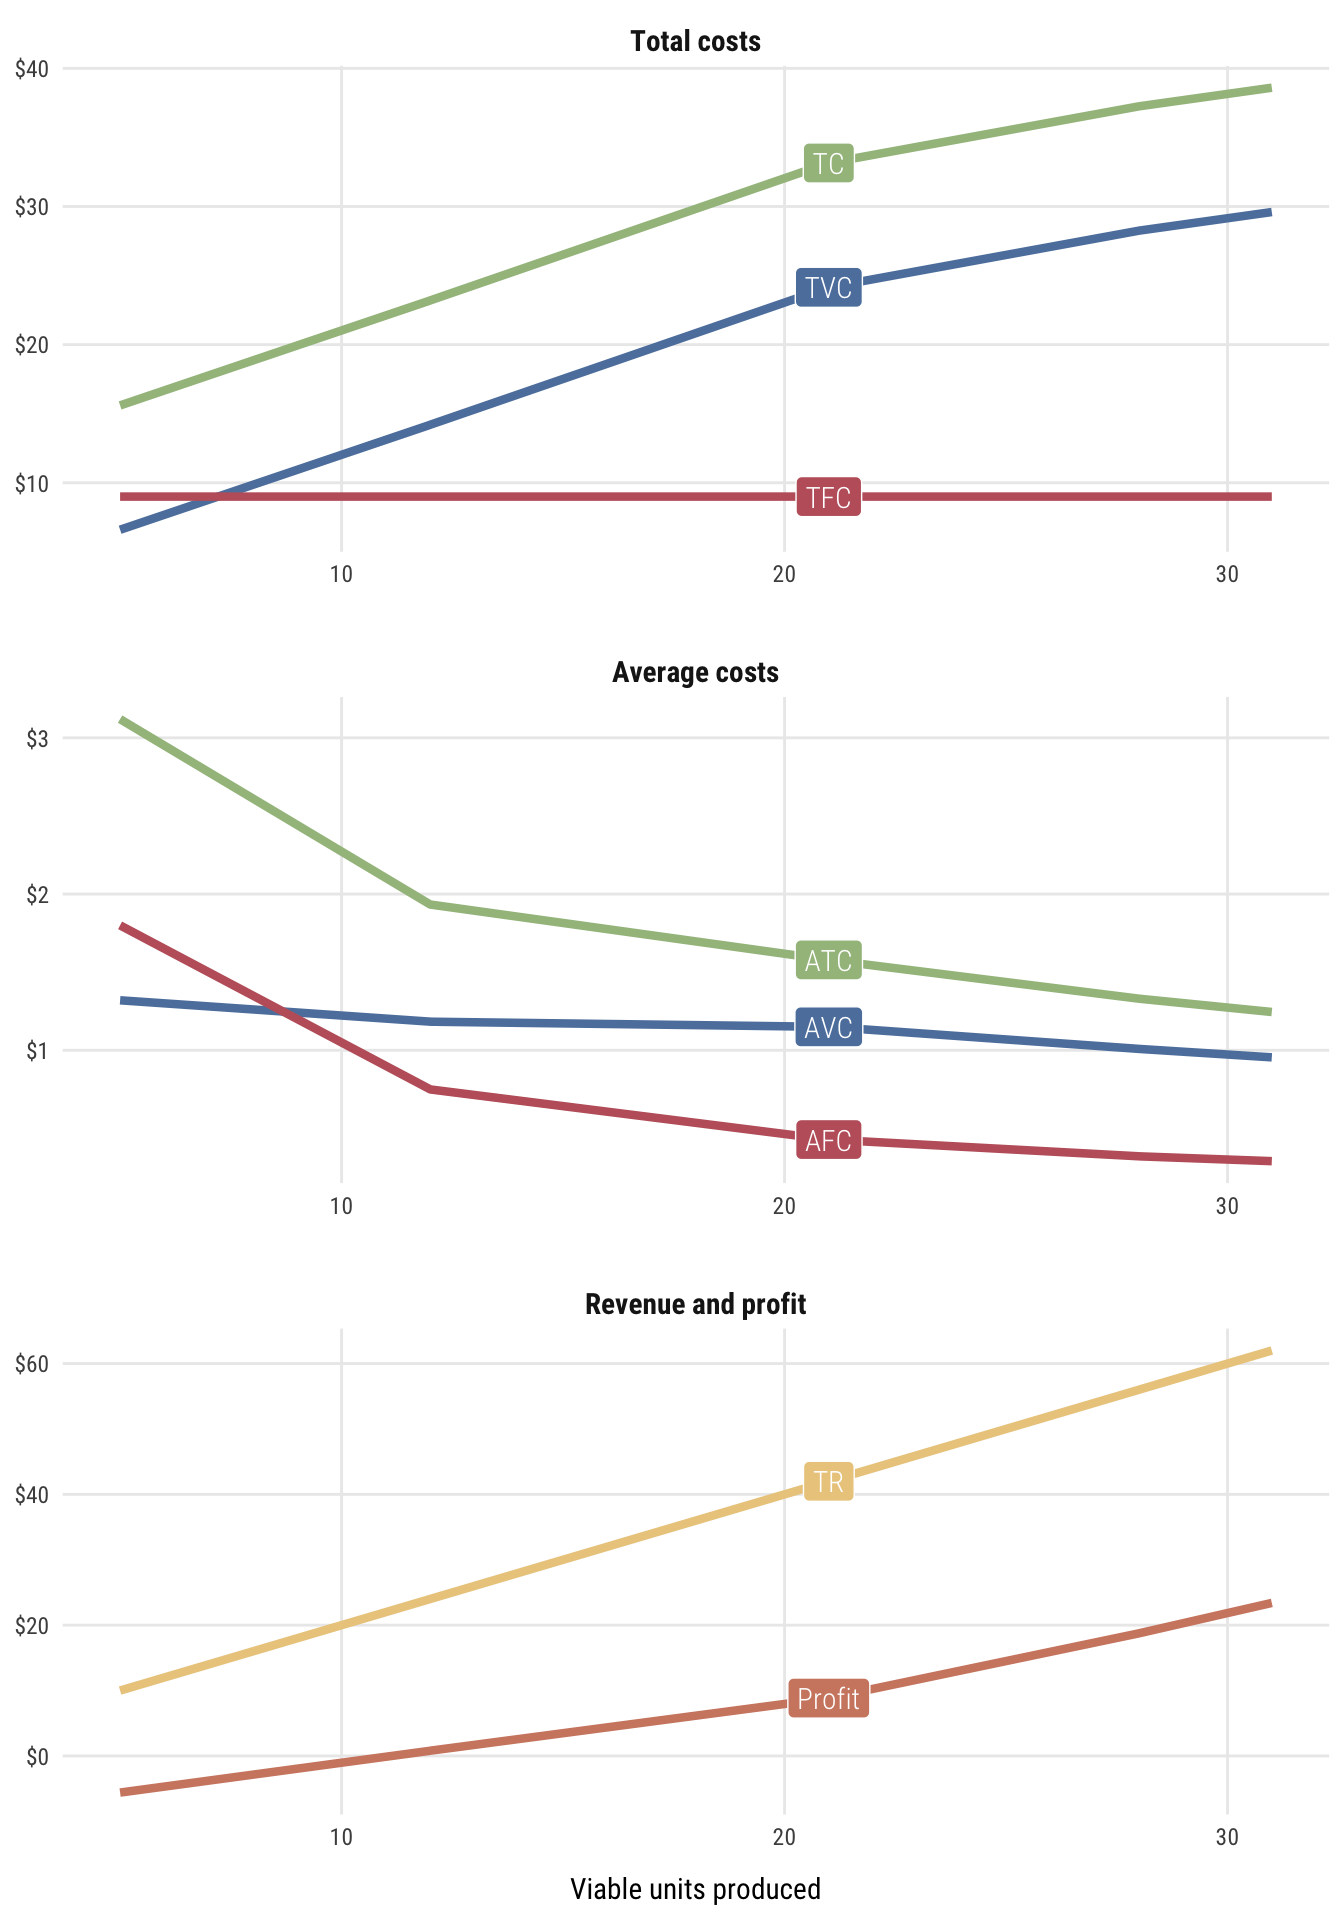
| Round | Viable units produced | TFC | TVC | TC | TR | AFC | AVC | ATC | MC | Profit |
|---|---|---|---|---|---|---|---|---|---|---|
| 1 | 5 | 9 | 6.6 | 15.6 | 10 | 1.8 | 1.32 | 3.12 | — | -5.6 |
| 2 | 12 | 9 | 14.2 | 23.2 | 24 | 0.75 | 1.183 | 1.933 | 20.97 | 0.8 |
| 3 | 21 | 9 | 24.15 | 33.15 | 42 | 0.4286 | 1.15 | 1.579 | 30.57 | 8.85 |
| 4 | 28 | 9 | 28.25 | 37.25 | 56 | 0.3214 | 1.009 | 1.33 | 32.51 | 18.75 |
| 5 | 31 | 9 | 29.6 | 38.6 | 62 | 0.2903 | 0.9548 | 1.245 | 26.18 | 23.4 |
Costs and revenue graphs
Clearest and muddiest things
Go to this form and answer these three questions:
- What was the muddiest thing from class today? What are you still wondering about?
- What was the clearest thing from class today?
- What was the most exciting thing you learned?
I’ll compile the questions and send out answers after class.